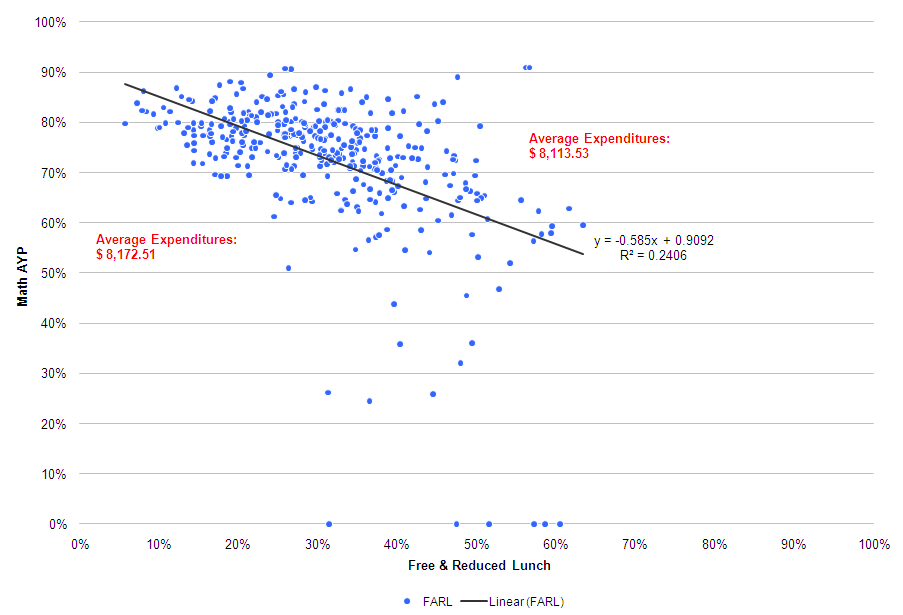
Below is a plot showing the relationship between the density of students receiving free and reduced lunch and the percent making progress in mathematics in Iowa school districts. Families with limited income are eligible for free and reduced lunch, so it’s a proxy for poverty. The regression line shows the negative relationship between free and reduced lunch and proficiency on Math AYP. That’s expected, we know students coming from low-income households struggle academically for a variety of reasons…
 Each point represents a district. A point above the line means the district has done better-than-average in getting students to pass the Math AYP. In a sense, those districts have added value. The points below the line mean schools have done worse-than-average. It’s interesting though that the expenditures per students for “value-added” school districts ($8,114) is roughly the same as below-average school districts ($8,173). Over 24% of the variation in test scores is explained by the low-income proxy (free and reduced lunch, if anything, is under reported). This evidence doesn’t definitively say expenditures per student doesn’t help improve test perforamnce, but it’s interesting.